
Your biomarkers. Your body. Your story.
More than laboratory results — a deeper understanding of you. 1,000+ interactive biomarkers, connected to your personal medical record.
A living map of your biology.
Lab results arrive as numbers few people can read. StoryMD turns each biomarker into a clear, visual explanation, mapped to your own record and tracked over time, so a page of values becomes an understanding of you.
Metabolic & glucose
Lipids & cardiovascular
Inflammation
Hormones
Thyroid
Complete blood count
Iron, vitamins & nutrients
Kidney
Liver
Longevity & aging
A sample of the biomarker library.
Blood Glucose Test
Fasting glucose reference range
Use the slider below to see how your results affect your health.
Your result is .
From scattered clues to one story.
Your record holds thousands of results, arriving one report at a time from labs, imaging, genetics, symptoms and wearables. StoryMD connects them into a single, visual narrative that follows you over the years.
- HbA1c 5.3% imported spreadsheet, 2000
- HbA1c 5.4% PDF report, 2004
- HbA1c 5.6% Quest Diagnostics, 2008
- HbA1c 5.5% Labcorp, 2011
- HbA1c 5.9% Dr. Patel's office, 2015
- HbA1c 6.3% Mount Sinai, 2019
- HbA1c 6.0% CVS MinuteClinic, 2022
- HbA1c 5.6% Cleveland Clinic, 2026
- Normal
- Borderline
26 years of HbA1c from eight places, one line in the record
Ask your companion anything.
Each result is captured as structured, LOINC-coded data — value, unit, date and source — then your AI companion can answer anything about it, grounded in your whole history.
Here, someone asks about the HbA1c story above and gets an answer that reads all eight results together: where they came from, what changed, and what to ask next.
Read your bloodwork with new eyes.
What each test measures and what its results mean, what your labs reveal about performance and aging, and which biohacks the evidence supports, explained on StoryMD.
Biomarkers power every health journey on StoryMD, and they are the foundation of the Stay well experiences: prevention and longevity.
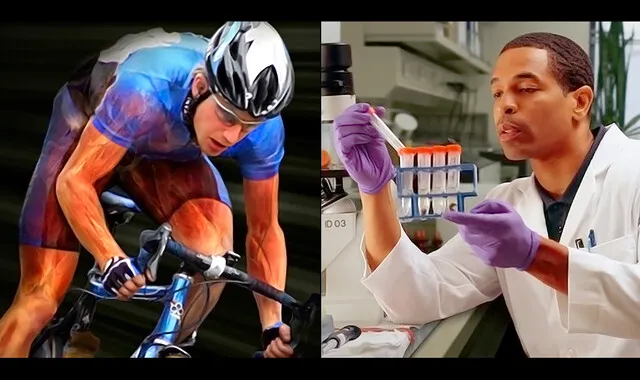 Story
Performance, revealed in your bloodwork
How hormone, nutrient and inflammation panels uncover what holds your performance back.
 Story
Your body, optimized
Which science-backed biohacks actually work, from sleep to tech.
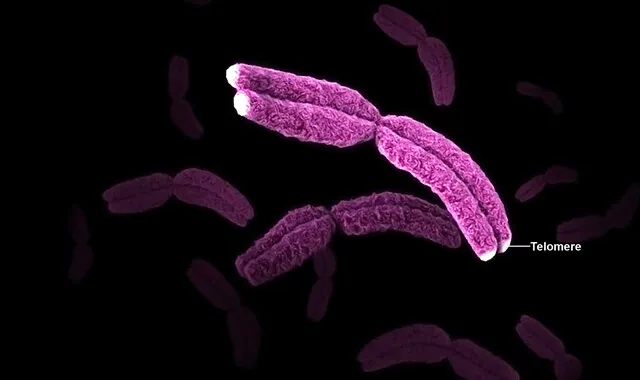 Story
Preserving telomere length
Why telomeres shorten with age, and how protecting them may slow aging.
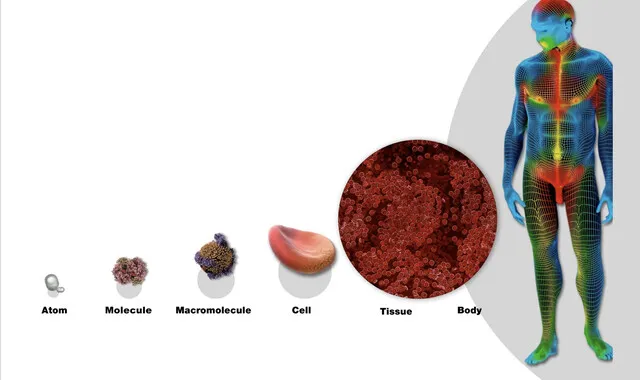 Journal
Biomarkers
What biomarkers are, how they're measured, and what they tell you about your health.
 Journal
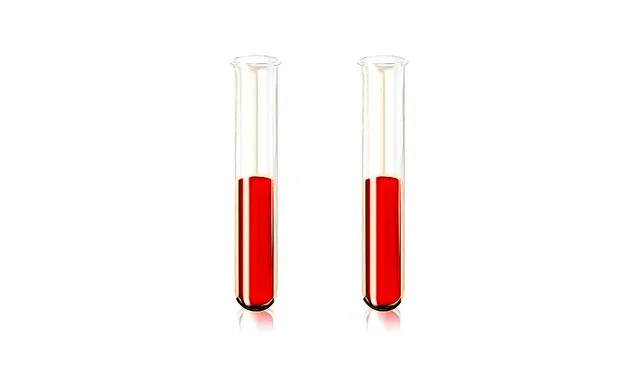
Diabetes tests and diagnosis
How HbA1c and glucose tests find prediabetes and diabetes.
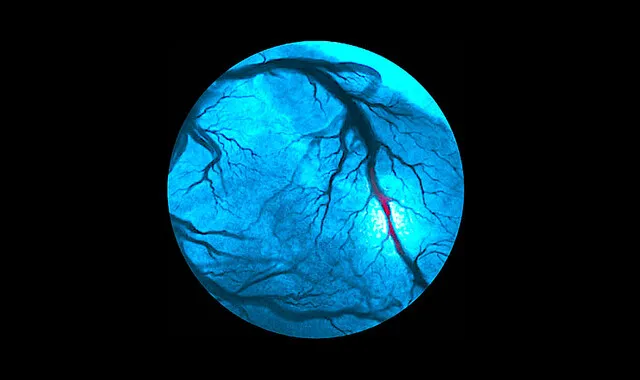 Journal
Heart tests
The tests that find heart disease early, before it causes problems.
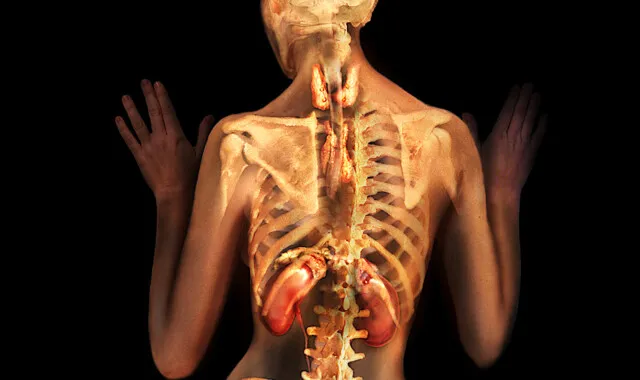 Journal
Thyroid tests
How TSH, T3 and T4 show whether your thyroid is working as it should.
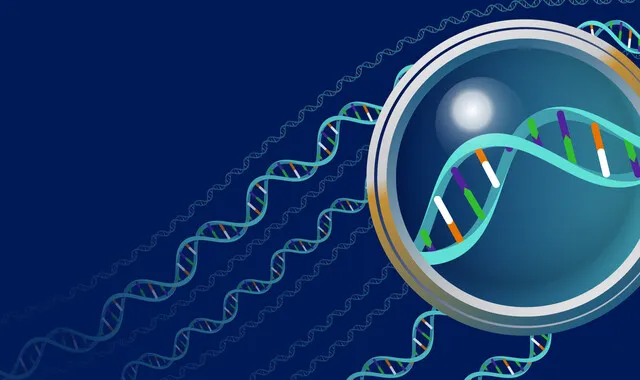 Journal
Genetic testing
How tests of genes, chromosomes and proteins reveal inherited risk.
{"resourceType": "Observation","code": {"coding": [{"system": "http://loinc.org","code": "718-7","display": "Hemoglobin [Mass/volume] in Blood"}]}}
The same test, the same code, from any lab.
Every test in the library is mapped to its LOINC codes, so a result that arrives from any lab is recognized, recorded with its value and unit against its reference range, and connected to the page that explains it: results from different labs line up on one timeline.